Introduction
Although Application Insights does log HTTP requests out-of-the-box, it doesn't provide a turn-key-ready solution that also logs the content of a request/response body.
This however might be required for some debugging scenarios and luckily we can extend the telemetry data with our own metrics and logs.
In this article, I am showing how to log the body of an HTTP POST or PUT request and also the response to Azure's Application Insights by leveraging custom middleware components.
A word of caution
Writing the content of an HTTP body to Application Insight might reveal sensitive user information that otherwise would be hidden and protected in transfer via TLS. So use this with care and only during debugging or developing!
Update
I have published a NuGet package that encapsulates the content of this post. You can use with dotnet add package Azureblue.ApplicationInsights.RequestLogging and find more about the code on the official project site.With that being out of the way let's see some code!
Writing a custom middleware
When using ASP.NET Core an HTTP request travels through a chain of request delegates that allows us to tap into and log the HTTP body content away.
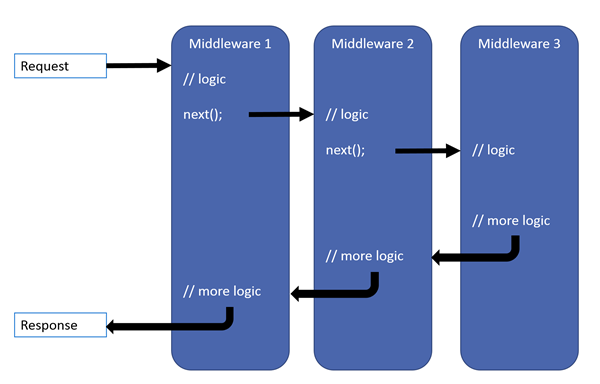
There are two ways to write custom middleware. One is by following a convention-based approach and the other one implementing IMiddleware that gives us strong typing and per-request activation. I prefer the latter, although it lacks the option to pass arguments to it.
With the great documentation that Microsoft provides, it all seems straightforward. However, there is one banana skin 🍌to get around.
When reading from HttpContext.Request.Body via StreamReader() we need to keep a copy of the data and reset the stream position to the beginning so that other request delegates (middleware components) are also able to read from it. If you don't reset the position you will end up with a HTTP 400 or even HTTP 500 response.
Also when dealing with the HTTP response HttpContext.Response.Body we need to swap out the stream with one that is buffered and that supports seeking. We are going to use MemoryStream for this purpose.
So without further ceremony here is the code that I put together with the help of this great article here.
public class RequestBodyLoggingMiddleware : IMiddleware
{
    public async Task InvokeAsync(HttpContext context, RequestDelegate next)
    {
        var method = context.Request.Method;

        // Ensure the request body can be read multiple times
        context.Request.EnableBuffering();

        // Only if we are dealing with POST or PUT, GET and others shouldn't have a body
        if (context.Request.Body.CanRead && (method == HttpMethods.Post || method == HttpMethods.Put))
        {
            // Leave stream open so next middleware can read it
            using var reader = new StreamReader(
                context.Request.Body,
                Encoding.UTF8,
                detectEncodingFromByteOrderMarks: false,
                bufferSize: 512, leaveOpen: true);

            var requestBody = await reader.ReadToEndAsync();

            // Reset stream position, so next middleware can read it
            context.Request.Body.Position = 0;

            // Write request body to App Insights
            var requestTelemetry = context.Features.Get<RequestTelemetry>();
            requestTelemetry?.Properties.Add("RequestBody", requestBody);
        }

        // Call next middleware in the pipeline
        await next(context);
    }
}public class ResponseBodyLoggingMiddleware : IMiddleware
{
public async Task InvokeAsync(HttpContext context, RequestDelegate next)
{
var originalBodyStream = context.Response.Body;
try
{
// Swap out stream with one that is buffered and suports seeking
using var memoryStream = new MemoryStream();
context.Response.Body = memoryStream;
// hand over to the next middleware and wait for the call to return
await next(context);
// Read response body from memory stream
memoryStream.Position = 0;
var reader = new StreamReader(memoryStream);
var responseBody = await reader.ReadToEndAsync();
// Copy body back to so its available to the user agent
memoryStream.Position = 0;
await memoryStream.CopyToAsync(originalBodyStream);
// Write response body to App Insights
var requestTelemetry = context.Features.Get<RequestTelemetry>();
requestTelemetry?.Properties.Add("ResponseBody", responseBody);
}
finally
{
context.Response.Body = originalBodyStream;
}
}
}For enhanced comfort, I suggest creating two extension methods that allow for clean integration in Startup.cs with a call to app.UseRequestBodyLogging() or app.UseResponseBodyLogging() accordingly.
public static class ApplicationInsightExtensions
{
    public static IApplicationBuilder UseRequestBodyLogging(this IApplicationBuilder builder)
    {
        return builder.UseMiddleware<RequestBodyLoggingMiddleware>();
    }

    public static IApplicationBuilder UseResponseBodyLogging(this IApplicationBuilder builder)
    {
        return builder.UseMiddleware<ResponseBodyLoggingMiddleware>();
    }
}Don't forget to register the new types with the DI container.
public void ConfigureServices(IServiceCollection services)
{
    // ...
    services.AddApplicationInsightsTelemetry(Configuration["APPINSIGHTS_CONNECTIONSTRING"]);

    services.AddTransient<RequestBodyLoggingMiddleware>();
    services.AddTransient<ResponseBodyLoggingMiddleware>();
}To ensure logging does not get enabled in production environments only enable the custom middleware components inside the condition that checks if we are running in a development environment.
public void Configure(IApplicationBuilder app, IWebHostEnvironment env)
{
    if (env.IsDevelopment())
    {
        app.UseDeveloperExceptionPage();

        // Enable our custom middleware
        app.UseRequestBodyLogging();
        app.UseResponseBodyLogging();
    }

    // ...
}And that's it! 😎 Let's run through a quick test and see the results!
Testing
One of the great things about Application Insight is that the results show up really quickly in the Azure Portal. So fire up your ASP.NET Core project and send a POST request to a corresponding endpoint. Here is a sample controller and simple DTO for your convenience.
[Route("api/[controller]")]
[ApiController]
public class UserController : ControllerBase
{

    private readonly ILogger logger;

    public UserController(ILoggerFactory loggerFactory)
    {
        this.logger = loggerFactory.CreateLogger<UserController>();
    }

    [HttpPost]
    public ActionResult Index([FromBody]User user)
    {
        return Ok(user);
    }
}public class User
{
public string FirstName { get; set; }
public string LastName { get; set; }
public int Age { get; set; }
}Here we are sending the HTTP Post Request with the help of cURL.
curl --header "Content-Type: application/json" --request POST --data @body.json https://localhost:44331/api/user End-to-end transaction details
Goto your Application Insights resource and navigate to Investigate > Transaction Search. Optionally set Event Types = Request and click on one of the logged items.
You will end up with a view like this showing our custom properties which we defined as RequestBody and ResponseBody.
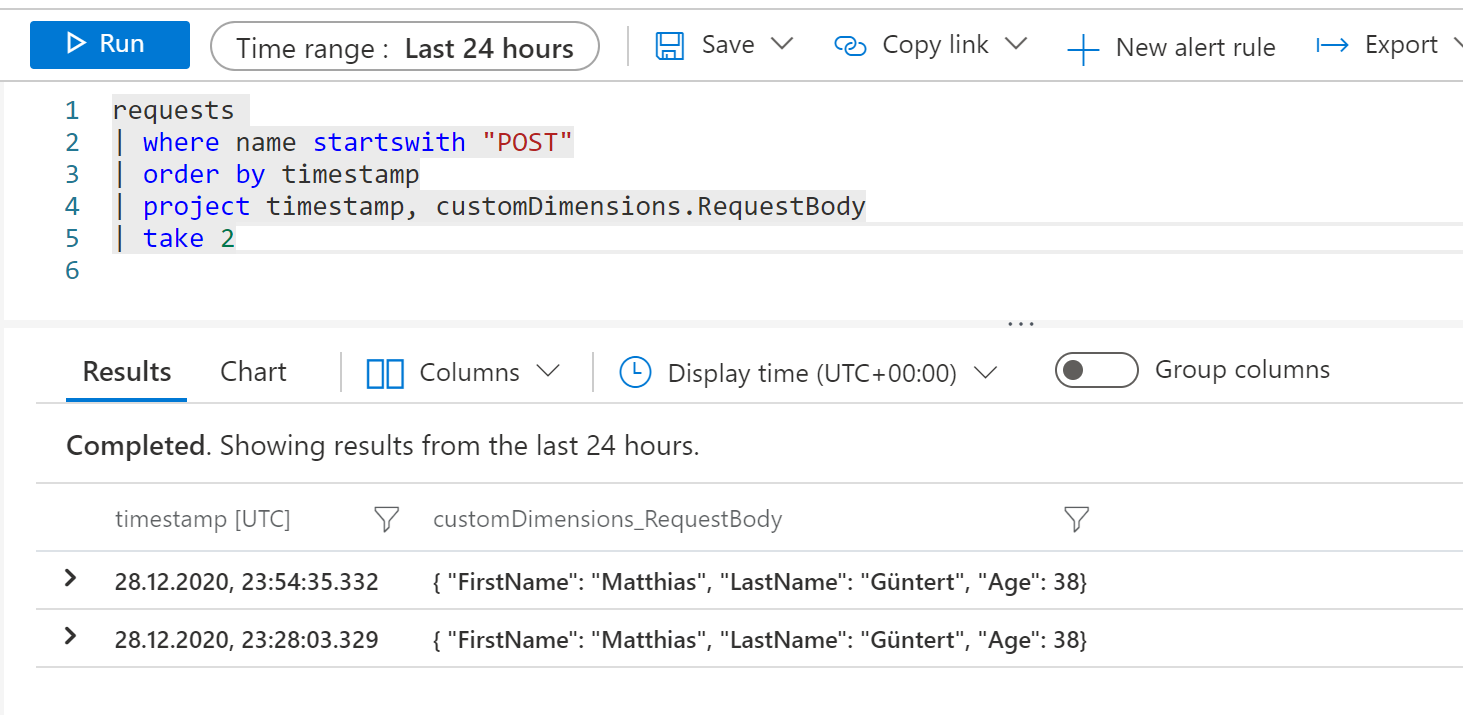
Log Queries
Alternatively you can use Log Analytics in Azure Monitor which gives you more control over your attributes and better adapts to specific needs.
requests
| where name startswith "POST"
| order by timestamp
| project timestamp, customDimensions.RequestBody
Conclusion
For sure many roads lead to Rome. Others might want to implement their own version of ITelemetryInitializer or use an ActionFilterAttribute from Microsoft.AspNetCore.Mvc.Filters instead. However I found it convenient that HttpContext is already available when implementing IMiddleware and doesn't need to be injected.
As we have seen, adding custom properties to our Application Insights telemetry data is no big deal. Also extending an ASP.NET Core pipeline can be fun, however it needs some care when dealing with the streams!
I hope you enjoyed this short article, in case you have any questions or comments please leave them in the comment section or drop me a mail.
Further reading
 Jeremy Meng